Footfall Analytics for Retail Stores:
Turn Traffic, Heat Maps and Dwell Time Into Sales
Your till tells you what sold. Footfall analytics tells you who walked in, where they went, how long they stayed and who left without buying. This guide explains the store metrics that matter, how AI measures them from the CCTV you already have, and the decisions retailers change once they can see them.
01 · The blind spot
What does sales data miss about your store?
Two stores in the same chain can post identical sales and be in very different health. One had 900 visitors and converted 30% of them. The other had 1,800 visitors and converted 15%, which means hundreds of shoppers walked in ready to look and left with nothing. Point-of-sale data cannot tell those stores apart.
Footfall analytics closes that gap. By counting every visitor and following how they move through the store, it turns the shop floor into data you can compare by hour, by zone and by location. It is the core of our retail analytics software, and the metric that most changes how store managers plan their week.
02 · How it measures
How does AI footfall analytics count and map visitors?
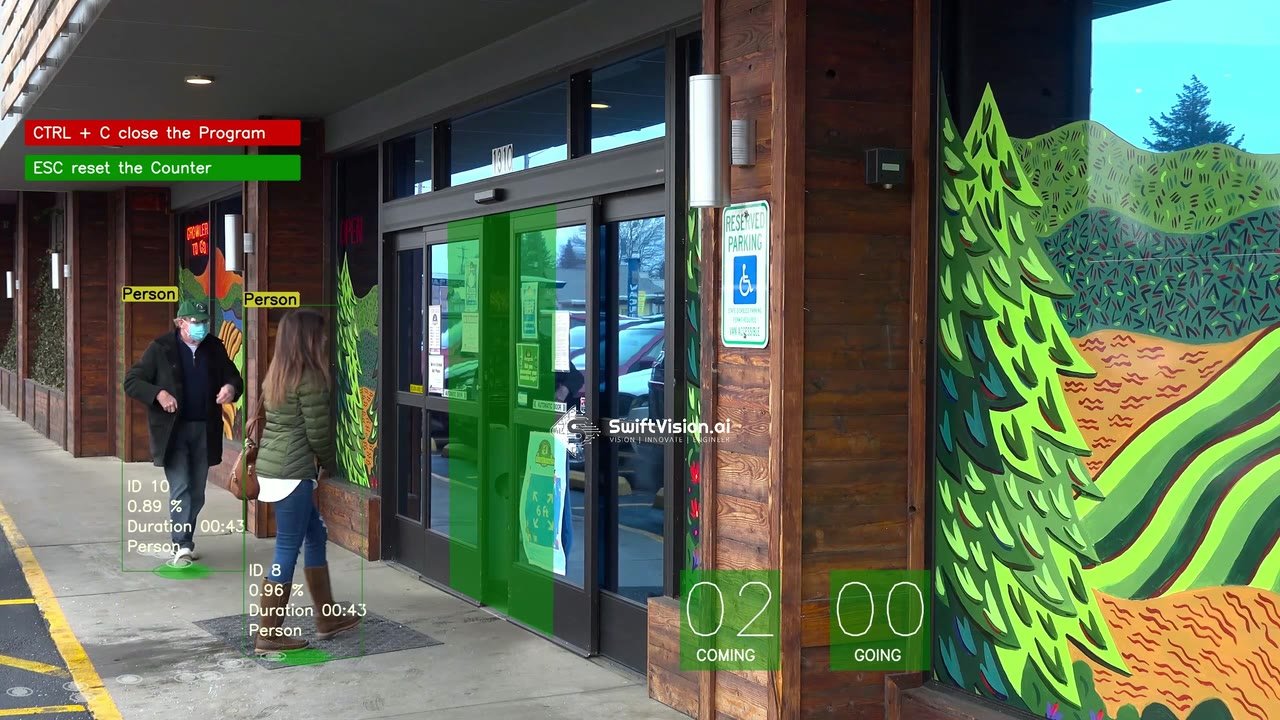
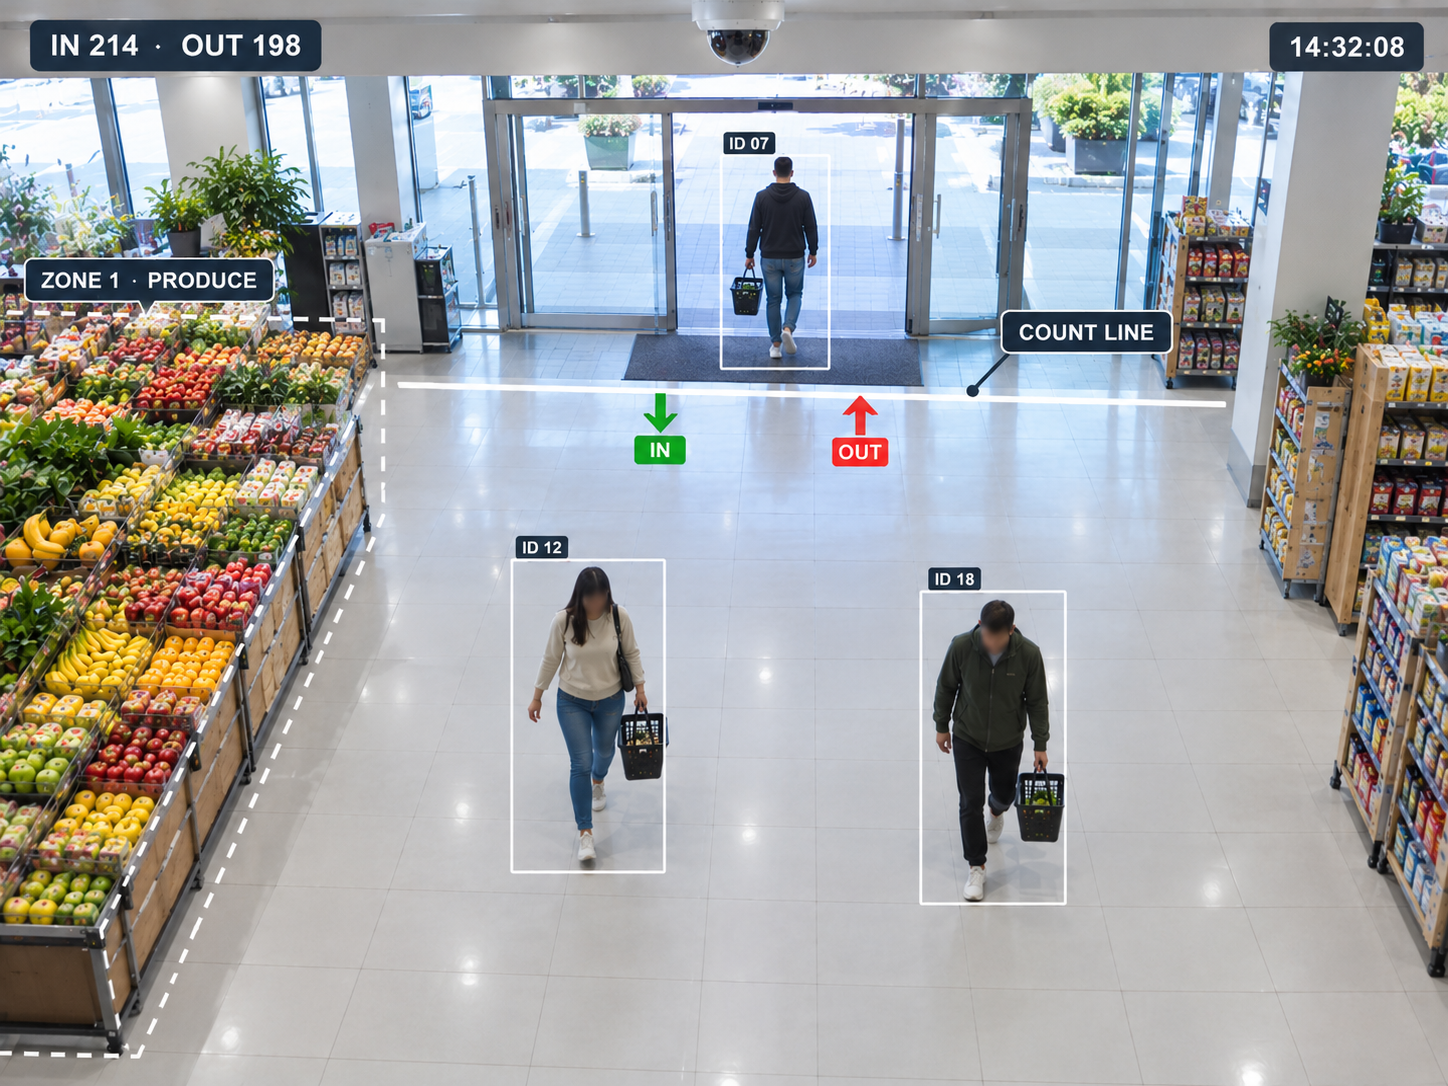
It starts at the door. A camera above the entrance runs a people counting model that detects each person and counts them as they cross a virtual line, in and out separately. Groups walking side by side are still counted individually, and staff can be excluded by uniform or by the back-of-house doors they use.
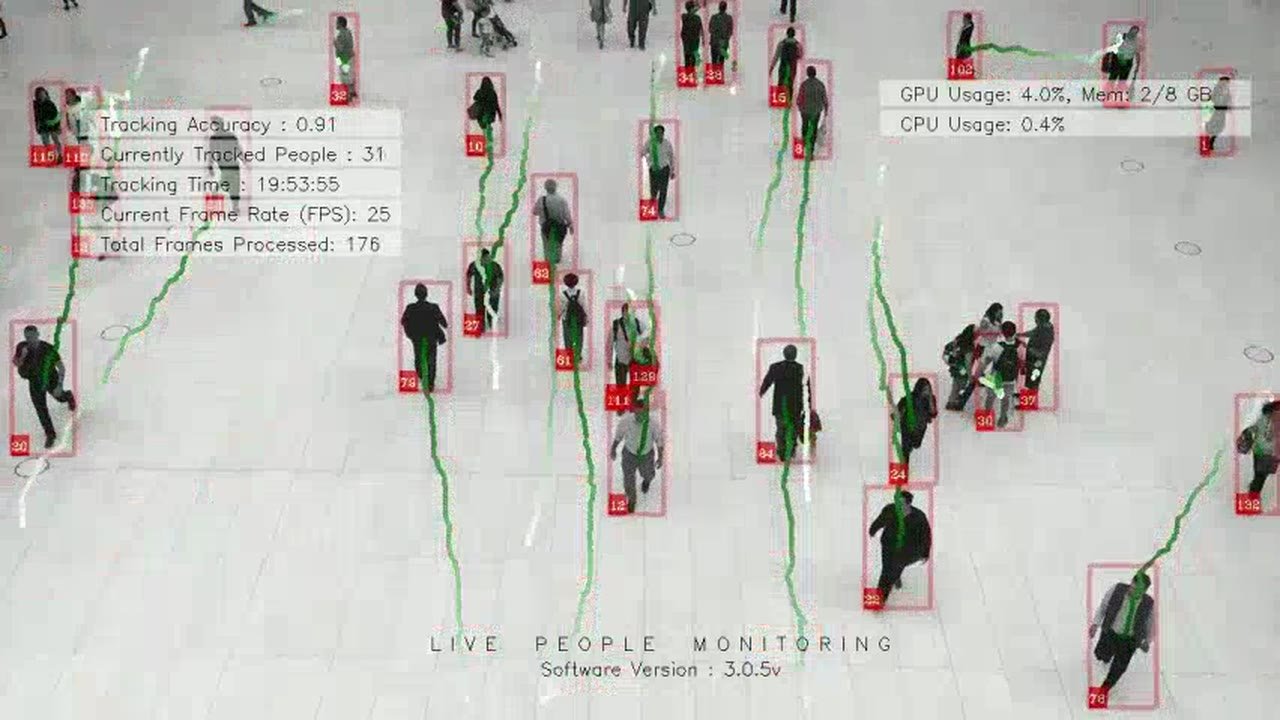
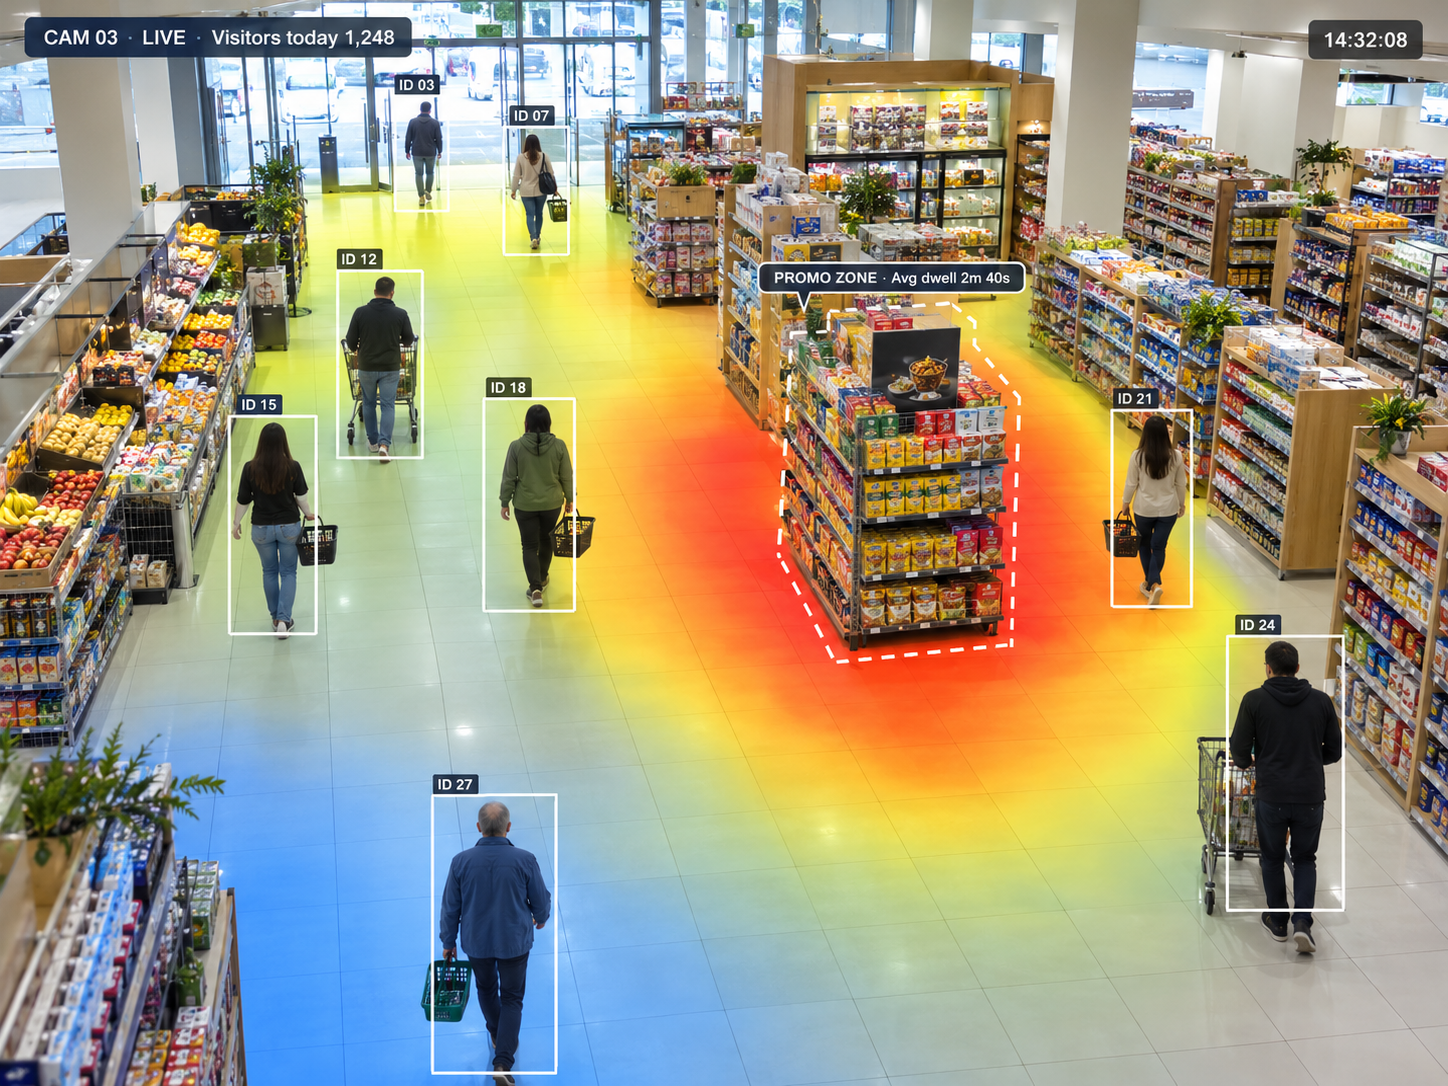
Inside the store, ceiling cameras track anonymous shoppers between frames and check which zones they enter, such as a promotional table, a fitting room queue or the checkout. Time spent in each zone becomes dwell time, and positions added up over a day become a heat map retail teams can read at a glance. No faces are stored and no one is identified: the system only needs to know that a person was in a place, not who they are.
03 · Store KPIs
Which five store KPIs should retailers track?
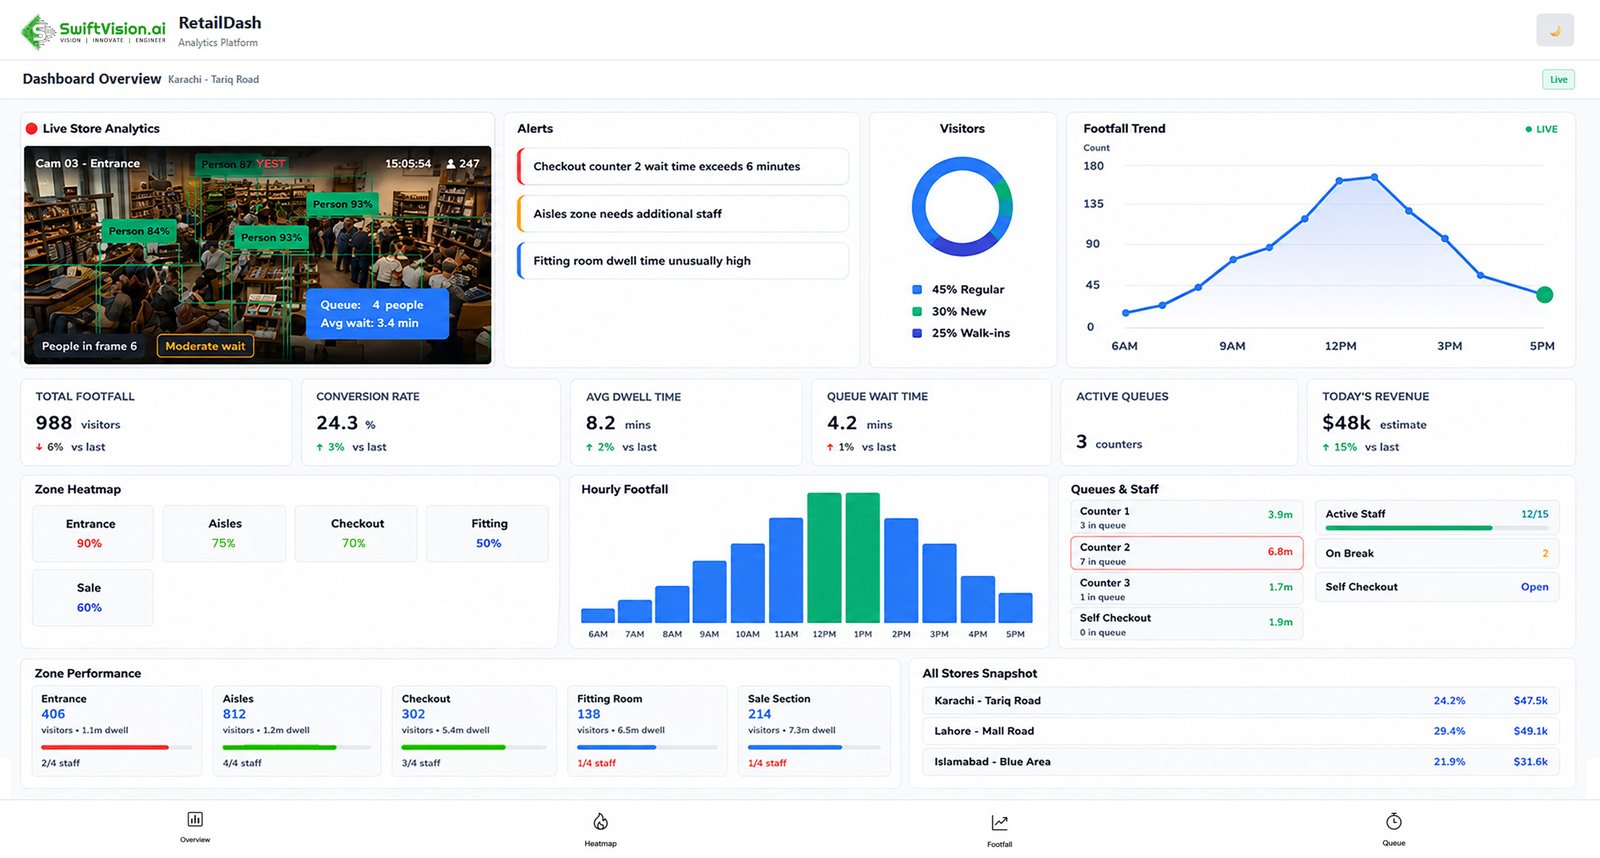
Five numbers cover most retail decisions. Footfall is the count of visitors by hour. Conversion rate is transactions divided by footfall, so 240 sales from 1,200 visitors is 20%. Zone capture rate is the share of visitors who enter a zone at all. Dwell time is how long they stay there. Queue length and wait show when checkout is losing sales. In one SwiftVision AI rollout, these KPIs were standardised across a whole chain, as our retail case study shows.
- 220Stores reporting the same KPIs in one SwiftVision AI rollout
- 42%Shorter queue wait times after live queue tracking
- 95%Conversion lift reported in the same retail deployment
04 · Rollout
How do you roll out footfall analytics on existing CCTV?
Most stores can start with the cameras already on the ceiling. A typical rollout looks like this.
-
 Step 01
Audit your cameras
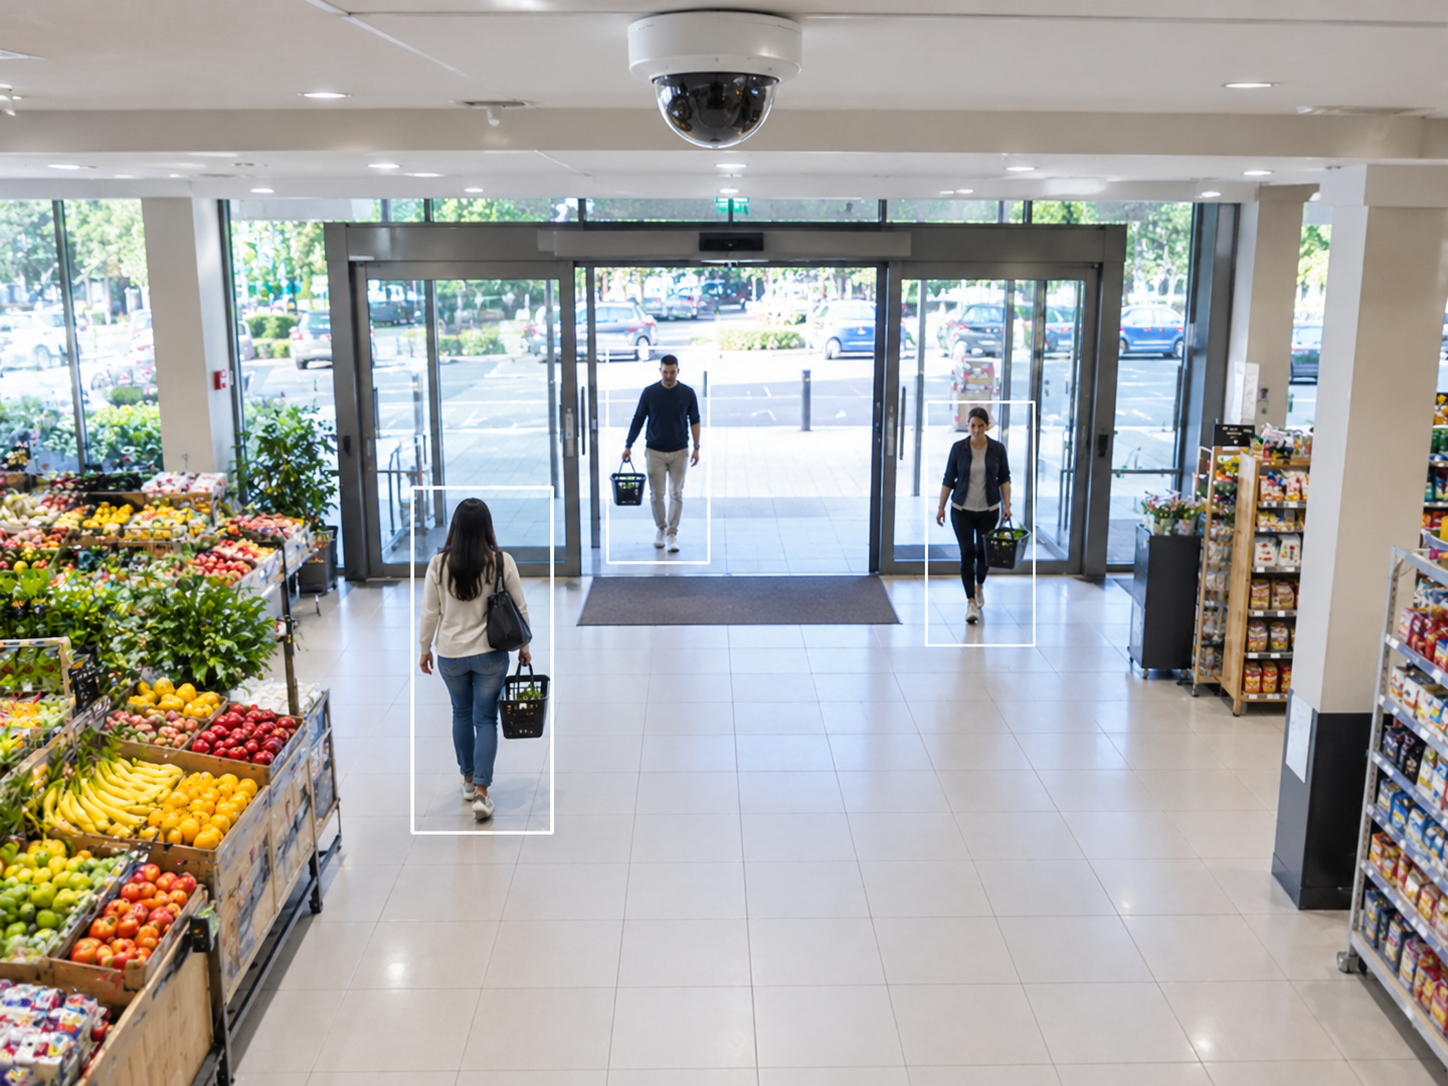
Check that the entrance camera looks down on the doorway and that key zones and the checkout are in view.
-
 Step 02
Draw lines and zones
Set a count line at each door and outline the zones you care about, such as promotions, aisles and tills.
-
 Step 03
Validate the counts
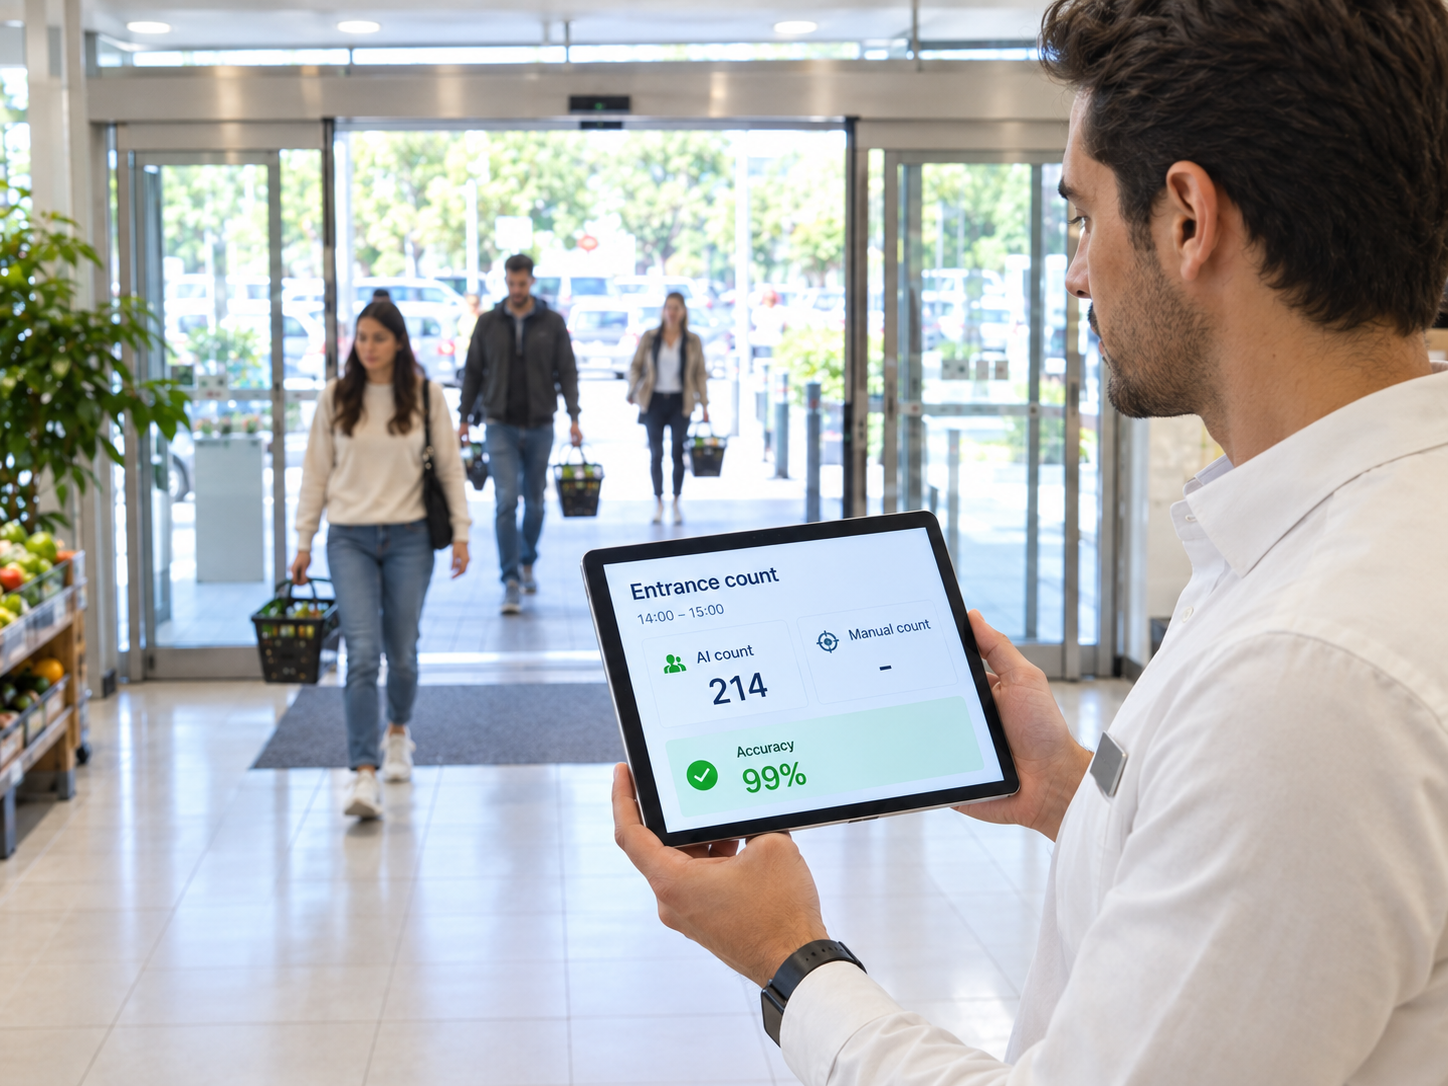
Compare the AI count with a manual tally for a busy hour, so everyone trusts the numbers from day one.
-
 Step 04
Act on the report
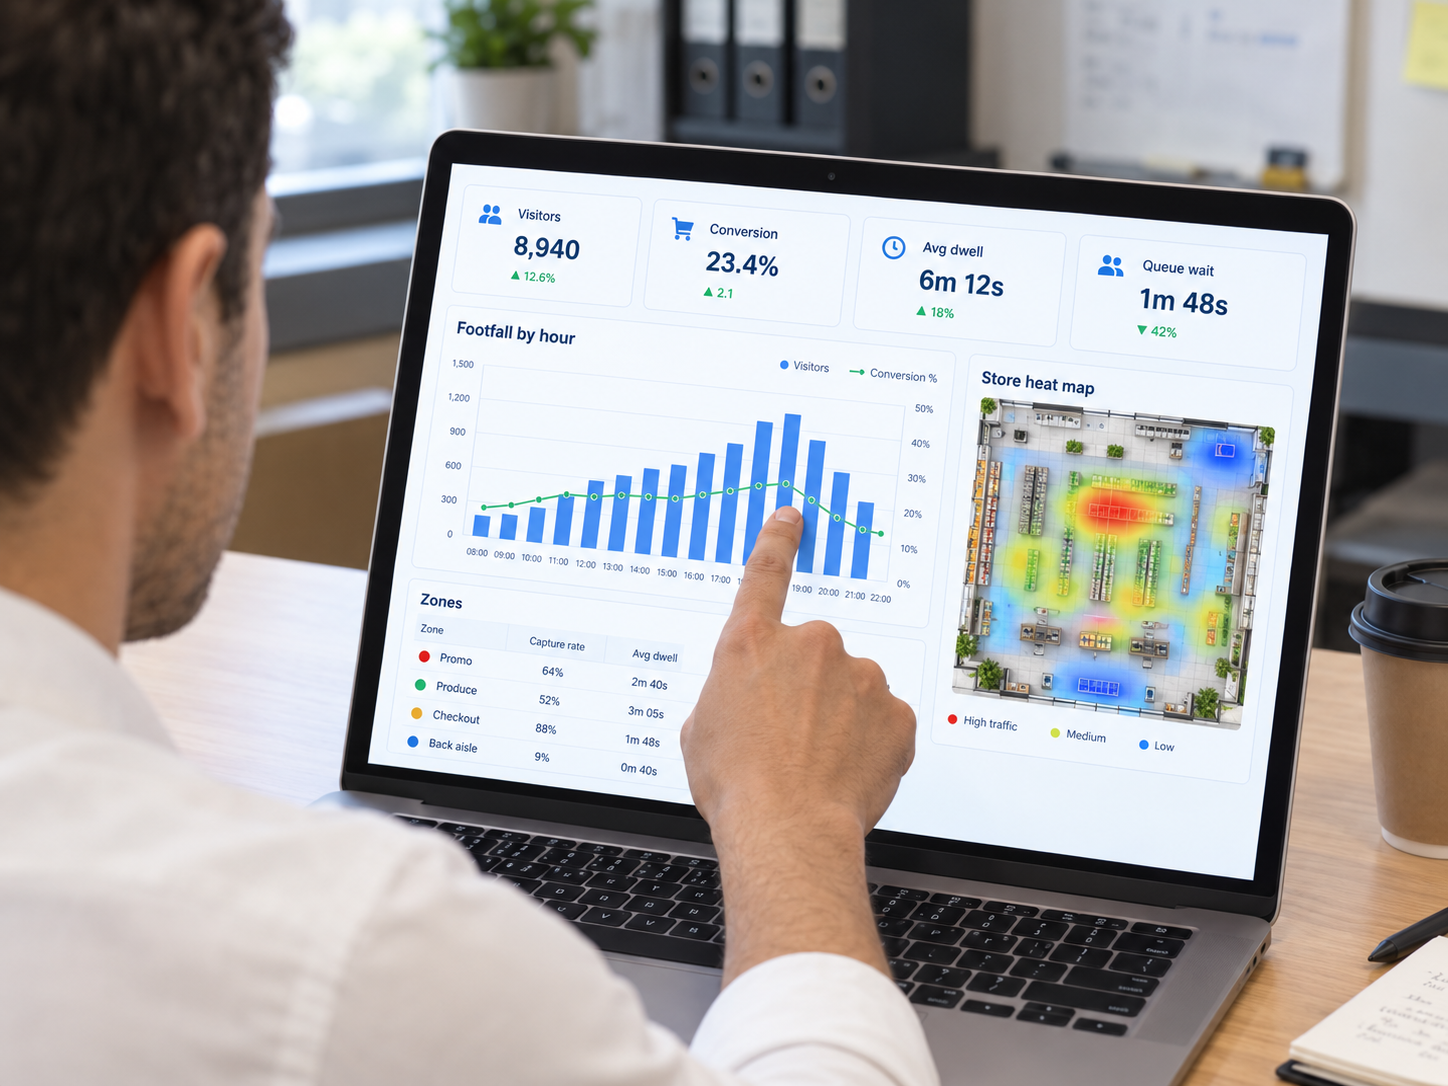
Review footfall, conversion and zone data every week and change one thing at a time, such as staffing or a display.
05 · Decisions
Which decisions does footfall data actually change?
Footfall analytics only pays off when it changes what happens on the shop floor. These are the decisions retailers act on most.
- Staff to traffic, not habit: compare footfall by hour with the staff rota. If conversion drops in the 5 to 7 pm peak, that is where extra people go.
- Fix cold zones: a zone with low capture rate is being walked past. Move a best-seller or change the sightline before cutting the range.
- Test displays properly: measure dwell time at a display for two weeks before and after a change, instead of judging by eye.
- Open more tills before the queue forms: live queue alerts tell managers when to open another till, before shoppers abandon baskets.
- Compare stores fairly: conversion rate removes the effect of location size, so you can see which managers turn traffic into sales.
06 · Counter types
Beam counters vs AI footfall analytics
Traditional door counters only answer how many people came in. Here is what changes with AI video. Whichever you choose, check your local data protection rules, such as the guidance from the UK Information Commissioner's Office (ICO).
| What you need | Beam or thermal counter | AI footfall analytics |
|---|---|---|
| Entrance count | Yes, groups often undercounted | Each person counted, in and out |
| Staff exclusion | Rarely possible | By uniform or staff doors |
| Zones and dwell time | No | Any zone you draw on camera |
| Heat maps and queues | No | Live heat maps and queue alerts |
| Hardware | A sensor at every door | Usually your existing CCTV |
07 · Store formats
Which retail formats use footfall analytics?
The same metrics answer different questions in each format. Our store entrance footfall counter demo shows the counting in action.
-
Fashion & specialty chains
Conversion by store, fitting room queues and display tests.
-
Shopping malls
Footfall by entrance, floor and tenant zone for leasing.
-
Grocery & convenience
Queue alerts, aisle heat maps and peak-hour staffing.
08 · FAQ
Frequently asked questions
How accurate is AI footfall counting?
With a camera looking down on the entrance and good lighting, AI people counting is typically very accurate, including for groups walking side by side. Accuracy depends mostly on camera angle, so we validate every entrance against a manual count before go-live.
Does footfall analytics use facial recognition?
No. Footfall analytics only needs to detect and count people and follow anonymous movement through zones. It does not need to identify anyone, so faces do not have to be stored, which keeps the system privacy-friendly. Our <a class="svb-link" href="https://swiftvision.ai/uncategorized/survillance-ai/">privacy-safe people counting</a> works the same way.
Can footfall analytics use our existing CCTV cameras?
Usually, yes. Most modern IP cameras can be used if they have a clear view of the doorway and the zones you want to measure. Entrance cameras mounted high and looking down give the best counting accuracy.
What is a good retail conversion rate?
It varies widely by category, store size and location, so there is no single target. The most useful benchmark is your own: compare conversion across your stores, days and hours, and track how it changes after you adjust staffing or layout.
Can staff be excluded from footfall counts?
Yes. Staff can be excluded by recognising uniforms or by not counting movement through staff-only doors, so footfall and conversion rate reflect real shoppers.
How long does it take to roll out footfall analytics?
A pilot on one or two stores with existing cameras can usually go live within a few weeks, including counting validation. Chain-wide rollouts are then planned store by store. We share a timeline after a short call about your stores and cameras.

Retail and mall operators
See your stores in a new way
Book a 30-minute call. We'll review your store layout and cameras, and show which footfall, zone and queue metrics you can start measuring.